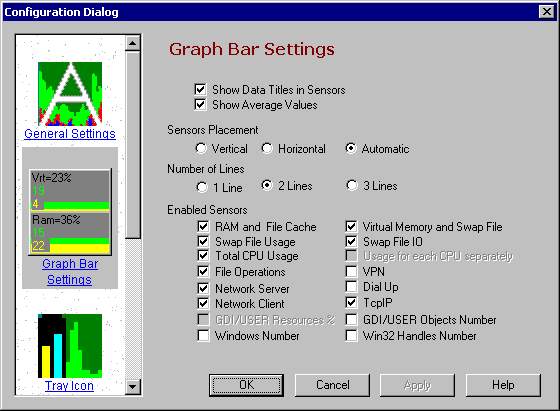
Graph Bar and Sensors Settings

Here you can configure what sensors are shown and how sensors are displayed.
· Show Data Titles in Sensors -- If checked, self explanatory titles are show for values on sensors. It may be needed for short time only while you are not remember value, it's color and meaning.
· Show Average Values -- Turn it on to show Values averaged during 10 refresh intervals. It is often usable with values such as CPU usage and data rates. These values displayed using underlining
· Sensors Placement -- Radio buttons below set how sensors are placed: vertically, horizontally or automatically. Last set vertical or horizontal setting depending on main window height, wide and number of sensors lines relation.
· Number of Lines -- When sensors placed horizontally means number of lines sensors placed in AbpMon main window.
· Enabled Sensors -- Check Boxes below enable/disable show of corresponding sensor.
See also: